
Hi Please try our teams new games. Download now from Google Play Store.
“z03- Zen Mobile Games 03” … run and jump !!! from Zen Mobile Games LLC.
New Games Available!
Filed under Uncategorized

Redbox vs Netflix
Redbox and Netflix are two companies on a collision course. Dominate players in different areas of the DVD rental space; they both now have their sights set squarely on internet streaming. To analyze how this battle is playing out over social media, let’s use some different social media analytics and measurement tools to compare and contrast these two titans.
Social Mention:

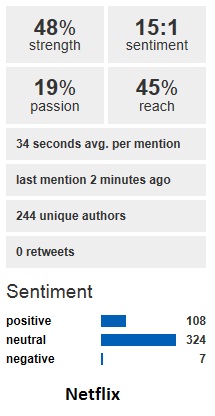
Netflix has higher scores on strength, passion, and sentiment. This tells us that Netflix is discussed more often and, because of the higher sentiment ratio, is discussed more favorably than Redbox. Netflix has more passionate advocates who discuss the brand more frequently.
Topsy:
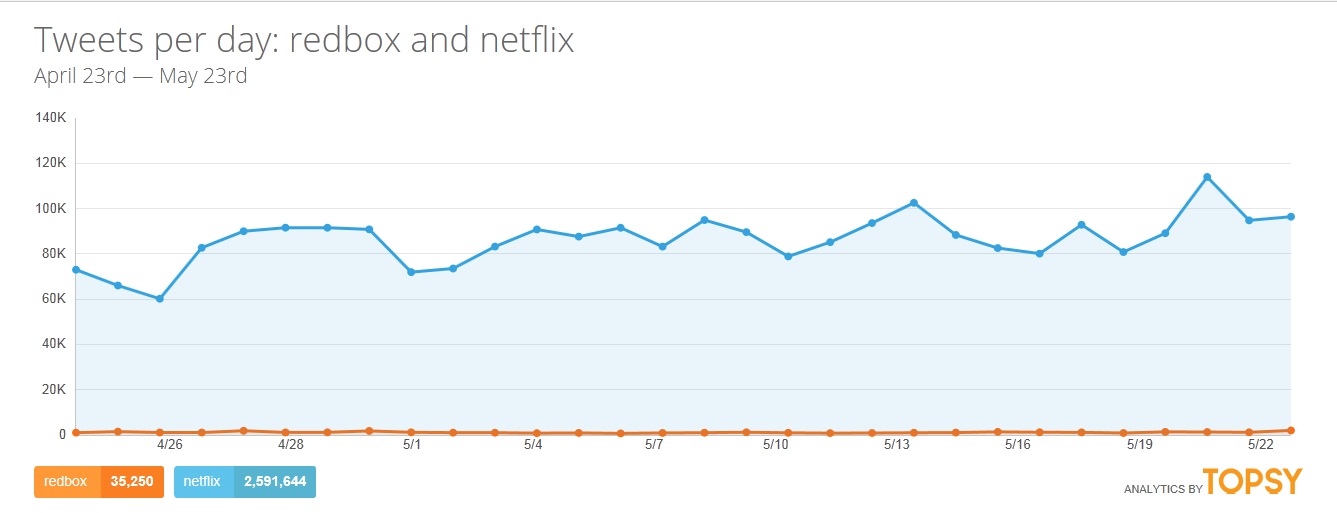
Topsy is a tool that shows data on tweets per day over different time periods. Here we can see the difference in tweets for Netflix vs Redbox is enormous; 35k Redbox tweets in the last month vs 2.6 million for Netflix.
Weather these stats are an indication that Redbox needs more focus on their social media strategy or that Redbox is lagging Netflix due to fundamental differences in the perception of their brands is up for debate. For Redbox’s sake, hopefully the former, which wouldn’t be as difficult of a fix, otherwise, they are in serious trouble.
Filed under Uncategorized
Xbox vs PlayStation
Tools:
- Social Mention: provide sentiment analysis and some metrics around strength, passion and ration between positive and negative sentiments.
- Topsy: also provide sentiment analysis (green and red), but also give a time based chart on the number of tweets over time that is interesting in understand if there is any buzz in tweeter sphere both positive or negative.
|
Xbox – Last Month |
PlayStation – Last Month |
| It’s interesting to understand what is going on with the “spike” that is happening about a week ago. One possibility is the announcement of a series of “consumer friendly” moves, such as unbundle Kinect from Xbox One to allow a price drop of $100 to match PlayStation 4 pricing, and allowing non-paying Xbox Live users to watch Netflix and Hulu. I also cross referenced the Microsoft stock price, and there is a minor semblance, but nothing conclusive. The exercise, unfortunately revealed the short coming of the current breed of social media analytics tools: the analytics numbers can be difficult to decipher until diving into individual tweets, which are difficult to do and seems to defeat the purpose of using the analytics. The top keywords do not reveal anything particularly insightful about why people are tweeting and perhaps a top hashtag analysis would help.
Although the two consoles are not far away in terms of global market share, they do have significant volume difference in terms of tweets between Xbox and PlayStation? It turned out, PlayStation’s tweets were spitted between the proper PlayStation 4 spelling and short hand PS4 spelling, with PS4 taking 2/3 of the tweet volume. This is an interesting fact that social media analytics is a very inexact science and require lots of knowledge of the community and audience to interpret the results.
|
Sony has 2 spikes one roughly 1 week ago and another earlier in the month, about 3 weeks ago. The one from last week is likely corresponding to the availability of April sales number that showed PlayStation 4 has outsold Xbox. The sales numbers are bragging rights for respective console fans in the “console war”, and it’s something people would likely mention in the social media to prove their platform of choice is “winning”. Looking at the stock price, there is no perceivable trends between social media buzz and stock price. There was absolutely not meaningful change in stock price during either spikes in social mention. The keyword again is not very useful or informative. There is no clues on what the peaks and volleys might be. The sentiment number might be interesting but the results are not very convincing. Some sort of “word cloud” color coded to their sentiment would probably help reveal more useful information for decision making and community engagement.
|


Filed under Uncategorized
Tableau vs MicroStrategy
At the start of the quarter we saw an analysis comparing the social media marketing of Tableau and MicroStrategy. Today I’d like to revisit that comparison with some analytics. First, let’s take a look at top level metrics: Engagement, Page Fans, People Talking About This and Brand Posts. In each of these categories Tableau is the clear winner, with more than twice the numbers achieved by MicroStrategy:

Next let’s take a look at Fan Page Engagement:

As you can see, Tableau’s relative share of engagement is 89%. Part of this may be due to the fact that it’s newer to the market than MicroStrategy and is enjoying q buzz due to its rapid growth and adoption, but a look at the two sites shows the Tableau site is more interesting and engaging in terms of content and style.
Looking at fan engagement over time tells a similar story, with Tableau dominating:

Another key metric is Fan Interactions per Post, and here again, in Likes per Post, Comments per Post and particularly Shares per Post Tableau is killing it:

Looking at Engagement on Brand Posts, Tableau again sees more engagement, but also uses Photos which turn out to be the most engaging type of post, while MicroStrategy doesn’t post Photos:

Conclusion: in the area of Social Media Marketing, Tableau is eating MicroStrategy’s lunch!
Filed under Uncategorized
Wilderness Chic: Patagonia vs. The North Face

vs.
![]()
Patagonia and The North Face: Competing high-end outdoor apparel companies with retail presence across North America.
Both companies are based in California, were founded within five years of one another (Patagonia in 1973 and The North Face in 1968), and each has a certain cult following. The North Face maintains a brand that reflects a general affinity for the outdoors. In contrast, Patagonia’s brand is more representative of environmentalism and conscientious living. Each has retail presence in Seattle.
Here is a comparative breakdown of each company’s social overall social media metrics:
@Patagonia
Tweets: 6,169
Photos/Videos: 618
Following: 2,139
Followers: 160K
370k FB likes
# of US retail locations: 30
@TheNorthFace
Tweets: 6,916
Photos/Videos: 531
Following: 1,237
Followers: 197K
3.9m FB likes / 29k visits
# of US retail locations: 40
Using Topsy to run a deeper comparison over the past month, the explicit Twitter mentions follow similar patterns (and aptly appear similar to a mountain range).
The ebbs and flows of the chart may simply reflect a greater propensity to interact during weekdays than over weekends. Perhaps Social Media Management does not work weekends, and perhaps just as well twitter users understand this fact.
In order to measure the overall impact of each campaign, we’ll turn to Klout.
Though each score is relatively high, Patagonia’s presence (89) is slightly greater than that of North Face (84).

With similar engagement stats for both Twitter and Facebook, it’s worth diving into a few of the other networks to see where this discrepancy may be rooted. Each being Outdoor apparel companies, and the outdoors at times projecting brilliant aesthetics, I chose to examine Instagram:


It’s quite clear now: despite a similar number of posts, and despite following half as many accounts, Patagonia has more than 2x the number of followers as The North Face. To me, this clearly represents a brand much more in tune with the millennial generation. Perhaps they also feature more beautiful photography. Regardless, this is undoubtedly an issue for The North Face, and they need to figure out how to match Patagonia’s numbers.
Filed under Uncategorized
Social Ciclismo: Orbea v Cannondale
In my last post, I provided a brief comparison between two music services that are near and dear to my love of underground tunes. This time I decided to analyze how two of my favorite bike firms add up in the twittersphere.
Raised in rural Pennsylvania, just outside of Pittsburgh, I grew up with the state’s pride and joy of handmade bike manufacturers: Cannondale. Initially wrought out in the small town of Bedford in the ’70s, Cannondale has since grown and diversified into a world leader of mass-produced rides. One of my first dirt jumpers was a Cannondale, and my current racing XC mountain bike is a Scalpel (yes, with one of those whack Lefty shocks).
Enter Orbea. As my riding style evolved to more city and road treks, I developed a strong connection with Orbea. This firm is based in my cycling spirit’s home of the Spanish Basque Country. Founded in the ’30s, this former gun manufacturer has led the peloton with its attention to making the best climbing road frames in the world.
As I prepared to purchase my next racing road bike, I had to decide which of these deeply-ingrained labels I would climb on for my future road treks. Since my passion of cycling has entered into the social media realm, I decided to analyze how these two firms fared among other tech savvy followers. Focusing on their twitter presence, I used Moz’s followerwonk to crunch some comparative analyses:

Cannondale reigns supreme on total followers, engagement rate, and followers per day metrics. Orbea, however, dominates in the retweet, and URL tweet figures. Recalling my experiences with both channels, Orbea does a fine job of being all-inclusive with their content. They leave no stone unturned and at times create campaigns actioning followers to send in pics of children riding their Orbea kid bikes.
Moz’s social authority metric is a bit confusing. Their 100-point grading scale has Cannondale as a break-away 63 versus Orbea’s score of 56. I thought at first the formula would have weighted URL tweets and retweets in favor of Orbea, but since Cannondale has an almost 3.5x larger audience, their activities are equivalent to Orbea’s smaller cult following.
If you’re wondering which fork in the road I decided to take, after graduation I will be crawling on my brand new Orbea Orca. I can’t wait to take her on my tour of Portugal this autumn. Be on the lookout for tweets on @Orbea of the experience!
Filed under Uncategorized
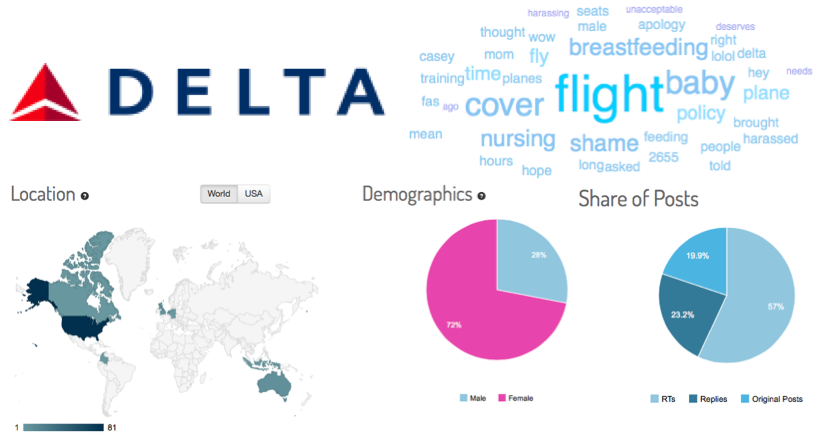
Social Media Analysis: American Airlines vs Delta
On our previous post “American Vs Delta : Which is the Largest Airline in Social Media” was analyzed the presence of American Airlines and Delta Airlines in the Social Media, now some analytics will be done to see how effective is their social media.
Topsy helps to monitor the traffic of the tweets per day, and can be observed that American Airlines has an average of almost 2,000 replies per day and Delta with an average of over 1,000 replies per day, indicating that American Airlines is more active/involved.

Social Mention displays different statistics like the strength, passion and reach of the tweets, it also has a sentiment analysis where it classifies the mentions in positive, neutral or negative to determine a ratio and also shows the latest mentions in Tweeter. For the two brands in question American Airlines tweets more and has a better sentiment score than Delta; the average time per mention for both companies is around 1 minute. Delta Airlines tweets/mentions have a better score in strength and reach but the sentiment ratio and passion favor American Airlines and here are the numbers:
American Airlines


Delta Airlines


Finally on Keyhole can be observed the geographical presence of the airlines and in the demographics American Airlines has more males tweeting/interacting with the brand and with Delta the women’s have been more vocal and mainly for an incident mentioned on some tweets shown on the picture above where a woman was not allowed to nurse a baby during the flight 2655. Keyhole also has a chart where the posts are classified on ReTweets, Replies and Original Posts and can be noticed that both companies replies are a significant amount of their social activity and this can be attributed to the customer service interactions.

Filed under Uncategorized
Using Deep Pockets, Strong Social Media Presence, and a Bit of Hype to Crush the Competition
Where the world of vacation rentals meets collaborative consumption you will find a cadre of both old and new companies each attempting to eek, rake, or shovel their revenues from the revolution that is the shareable economy. Some of the old timers like HomeAway, which owns VRBO have nearly a million properties listed on their various sites, catering to travelers around the world. Other new entrants like Airbnb presumably have a smaller number of properties, yet they also have a much slicker website and a far better user experience for both the owner and the renter. Interestingly Airbnb plays by a slightly different set of rules than other competitors in the space and instead of listing how many properties they have, they emphasize the number of cities (34k) and countries (192) where they have properties. With a market valuation of nearly $10B and oodles of investors pouring cash into Airbnb, are they creating a lot of hype, or are they doing something truly different? Let’s use social media to take a look at how these two competitors differ.
First let’s talk about their Klout scores:

Airbnb is looking good at 83, versus HomeAway’s 71. Granted, Airbnb doesn’t have the history and longevity of HomeAway but they have also gotten way more attention from the press. Although most of the attention is highly favorable, there have been few more scandals, like some sketchy Onion articles and some snafus around evasion of taxes, and yet also a lot more social media volume. As you can see in the ten-day chart below generated by Topsy, there were 73k tweets for Airbnb compared to only 1400 for HomeAway.

One could argue that volumes alone don’t tell the story, so when we look at sentiment as well, we see the score is still imbalanced with 76 for Airbnb versus a 48 for HomeAway:

In summary, with the nearly $1B in Airbnb investments over the past 5 years, and the involvement of more than a dozen major investors, this startup has taken the relatively stable and ordinary business model of renting out properties online, HomeAway’s bread and butter since 2004, and made it sexy, sleek, and modern. While one could argue that there are not many substantive differences in the business models and approaches of the two companies, it is clear that Airbnb is doing a far better job of selling themselves and their culture and is undoubtedly reaching more people. If a tree falls in the woods, does it make a sound? Who cares! Similarly if Airbnb has the same business model and approach as HomeAway, but is crushing them in terms of awareness, sentiment, tweet volume, etc, then does it really matter that they have the same model?
Filed under Uncategorized
Social Media Heavy Weight bout part Deux
In our last installment we looked at how the two social media titans, Facebook and Twitter actually used social media themselves. Our analysis showed they were both heavy users of their own dog food, but didn’t stray outside of their own box much.
This round we look at how the two titans match up across the board using some social media analytics tools. First off we’ll look at how the two fare overall using Social Mention.
 |
 |
As we can see, Facebook scores better on strength, passion, and sentiment. This suggests that Facebook has a higher likelihood of being discussed, and when discussed, much more likely to be favorable than Twitter. Twitter has more reach, with more individuals talking about twitter than Facebook with a healthy ratio of generally 5 positive comments to 1 negative comment. We’ll give round one to Facebook.
Let’s look specifically at Twitter traffic and see how the two rivals stack up. Luckily Topsy provides us with analysis of twitter traffic. Here we see counts of tweets per day for the last month mentioning Facebook, Twitter, and Social Networks.

This data confirms the Social Mention reach metrics, clearly showing that Twitter (at least on Twitter) has a higher volume of mentions. Based on this data and overall reach/mentions, we’ll give this round to Twitter.
For our decider we’ve chosen Follower Wonk to make the final judgment in our Social Media smack down. Normally we would analyze the followers of each of these companies, but the tool limits analysis to accounts with less than 850,000 followers. The two combined have over 44 Million followers. Given the limitation we choose to analyze who the company follows.

Delving into the details we see that Twitter follows more users, has more followers, and higher retweet percentage. We also see that Twitter has a higher total and weekly tweets as well as engagement and followers per day which confirms the data we saw with Social Mention. Now, this is Twitter’s home turf, so we’d expect Twitter to rough up any contenders on their own platform so the judges have met and we’re going to call this round a draw. So let us know who you think is better in Social Media, Twitter or Facebook
Filed under Uncategorized
Nissan vs. Toyota
By Farhad Teymurian
1) Topsy
Toyota has consistently more tweets per day than Nissan (about 4K more) that is about 120K more tweets per month.
2) Follower Wonk
Toyota follows 19,103 user while Nissan only follows 175 users.
3) Social Mention
Toyota and Nissan both have equal strength, yet Nissan has 26:1 positive sentiment compared to Toyota at only 6:1. This is most likely due to the sportier designs of the Nissan cars and brand.
4) Keyhole
Nissan has about 1 million more impressions than Toyota as well as 1 million more reach. Nissan also has greater percentage of males at 79% compared to Toyota at 77%. Again I think this is due to the sportier Nissan designs.


In summary:
Toyota has consistently more tweets per day than Nissan (about 4K more) that is about 120K more tweets per month. Toyota follows 19,103 user while Nissan only follows 175 users. Toyota and Nissan both have equal strength, yet Nissan has 26:1 positive sentiment compared to Toyota at only 6:1. This is most likely due to the sportier designs of the Nissan cars and brand. Nissan has about 1 million more impressions than Toyota as well as 1 million more reach. Nissan also has greater percentage of males at 79% compared to Toyota at 77%. Again, I think this is due to the sportier Nissan designs. Toyota maybe bigger and have more tweets, nevertheless Nissan is by far more liked (positive sentiment).
Filed under Uncategorized
Apple & Google: Neck & Neck
Evaluating Apple & Google – the two dominant players in smartphones & app stores – via SocialMention reveals very little space between them.
| Apple | |||
| Strength | Strength is the likelihood that your brand is being discussed in social media.
A very simple calculation is used: phrase mentions within the last 24 hours divided by total possible mentions. |
60% | 58% |
| Sentiment | Sentiment is the ratio of mentions that are generally positive to those that are generally negative. | 8:1 | 12:1 |
| Passion | Passion is a measure of the likelihood that individuals talking about your brand will do so repeatedly.
For example, if you have a small group of very passionate advocates who talk about your products or brand all the time you will have a higher Passion score. Conversely if every mention is written by a different author you will have a lower score. |
32% | 27% |
| Reach | Reach is a measure of the range of influence.
It is the number of unique authors referencing your brand divided by the total number of mentions. |
37% | 40% |
Google edges Apple in Strength while Apple marginally outpaces Google in Reach.
Slightly more significant differences appear in Apple’s better Sentiment ratio, and – surprisingly, given the stereotype of Apple fanboys – Google’s 5% advantage in passion.
But the waters are muddied again when looking at some of the underlying data:
| Apple | ||
| unique authors | 240 | 255 |
| positive | 83 | 108 |
| neutral | 385 | 350 |
| negative | 11 | 9 |
| total | 479 | 467 |
| opinion | 20% | 25% |
With so few negative opinions expressed about either and so many neutral opinions about both, the variations between the two are insignificant.
No clear winner between these two tech giants can be crowned.
Filed under Uncategorized
Christie’s vs. Sotheby’s Part II – Analytics
In order to analyze social media activity for both Christie’s & Sotheby’s, I used Topsy to look at their Twitter activity and Simply Measured to look at their Facebook activity. These are two most active channels for both. Christie’s is clearly winning the Twitterverse as well as Facebook both in terms of quantity and quality. Christie’s has higher number of followers and tends to do a better job sustaining the engagement of their followers. Sotheby’s appears to be using the channels primarily as a marketing channel to advertise for upcoming auctions or shows whereas Christie’s continues to have a dialogue with their clients to stay engaged.


Would you pick between the two based on their Social Media activity? If you say yes to that, then I recommend you click on the links above and make your own bid.
Filed under 2014 - Post 3, Analytics
Who is the winner? @SamsungMobileUSA vs @AppStore
Samsung and Apple take very different strategies in managing their brand reputation in the social media space. ‘Samsung mobile USA’ is very actively communicating with people through major social media channels such as Facebook, Twitter, Instagram, YouTube, and Google+. On the other hand, Apple has been reluctant about strengthening its brand awareness in social media space. But rather, it seems that Apple is only interested in promoting Apple’s contents and software distribution platforms that are iTunes and App Store. Apple’s only two official social media identities are iTunes on Facebook and App Store on Twitter.
‘Samsung Mobile USA’ vs ‘iTunes’ on Socialmention
Let me compare ‘Samsung Mobile USA’ with ‘App Store’ using socialmention to see general presence of those two companies in the social media space. I found a lot of similarities between those two, but at the same time, there are a few great differences as well. First, let’s take a look at the table below.

As you can see the table above, App Store has slightly larger figures in terms of strength and reach, but Samsung Mobile has higher passion and sentiment levels. Also, App Store is being mentioned every 15 seconds, while Samsung Mobile is 1 minutes. But in general, the differences are not significantly big.
But, there is an interesting big difference between them, which is Top Users. Please see the chart below.

It is obvious that Saumsung Mobile official twitter account itself is the most active influencer that creates various kinds of contents regarding Samsung Mobile USA. On the other hand, there is no official Apple account among Top 10 Users that are chatting about App Store. All things taken together, I can say that Samsung Mobile, the company itself is driving Samsung Mobile’s social presence, in other words, the majority of contents on social media regarding Samsung Mobile are company-generated contents. However, thanks to a lot of people who are creating buzz and contents in the social media space about App Store, Apple doesn’t seem to put as much money and resources as Samsung does.
‘Samsung Mobile USA’ vs ‘iTunes’ on Topsy

I used Topsy to analyze trends of tweets about @SamsungMobileUSA and @AppStore to compare them. In terms of consistency, SamsungMobileUSA is more volatile than Apple. Also, the average number of replies to @SamusungMobileUSA is approximately 500 per day, while @AppStore has 2k+ replies per day. (It’s almost 4 times bigger.) It simply shows that @AppStore has a stronger presence in twitter than @SamsungMobileUSA although Samsung is concentrating efforts to increase its social media presence.
Filed under Uncategorized
Is there really a differrence between H-D and Honda?
So, I have this lovely 3rd assignment with a deadline looming, not to say I am procrastinating, but it is getting along well towards the end of the deadline. I decided to pick two companies to compare their social media content and social authority that are in a similar industry but could be considered polar opposites: Harley-Davidson (H-D) and Honda. In the spirit of full disclosure, I own and ride both and there is nothing better than seeing people’s reaction when I ride my Honda Goldwing wearing my Harley regalia and vice versa (I wish I had a camera each time).
Using Follower Wonk, I was able to pull up the below Twitter statistics for both H-D and Honda:
Harley-Davidson
Milwaukee, WI
Social Authority: 71
Followers: 196,388
Days on: 2,023
Retweets: 20.0%
@Contacts: 1.0%
URL tweets: 68.5%
Honda
Torrance, Calif.
Social Authority: 79
Followers: 300,178
Days on: 1,817
Retweets: 0.5%
@Contacts: 85.5%
URL tweets: 13.0%
Of note, there were some significant differences and only two similarities in the profiles. This is my rundown of the numbers: H-D Has less than 200K followers while Honda has over 300K, but H-D retweets 20% of the time vs Honda’s .5%. I attribute this to H-D creating a more personalized voice relating more to their follower directly and individually while Honda gives a voice of communicating via a call or service center (customer support). Honda appears to reaches out @Contact much more than H-D, which I believe is because Honda is using a customer resource management (CRM) tool and H-D is using the initial tweet to reach out. The social authority and days on were, in my opinion, close with H-D being on ~200 days earlier, but Honda indicated a bit stronger in the social authority scale, perhaps due to the larger follower base.
I also found very interesting information on individuals whom the companies follow, and that there is a very small (.1%) overlap in where both H-D and Honda follow the same individuals (there may be more people like me out there in the web verse). While each company followed roughly the same number of individuals, the ratio of users followed by H-D was much higher at 5.3% (1049/196388) to Honda’s 3.9% (1180/300178), given H-D’s smaller follower base. Of particular note, there were 3 users that both companies followed, the following information refers:
Comparison of users Harley-Davidson & Honda follow:
1,049 users followed by Harley-Davidson
1,180 users followed by Honda
followed by Harley-Davidsons: 1,046 (47.0%)
followed by Honda: 1,177 (52.9%)
followed by both: 3 (0.1%)
Combined total followed: 2,226
Final observations:
I was expecting that given my experience with both companies, I was quite surprised at the extent that H-D engaged via Twitter and the size of the population following both companies. I was also quite amazed that I was (without much outside influence) be able to figure out how to use an analytical tool for the social media, and able to easily gather information that is useful. I believe the experience helps me understand better the power of the tool and the media used to reach out to customers and has inspired me to develop and incorporate a SMM element with my own business.
Filed under Uncategorized
Who has better sentiment, Nike or Reebok?
In the past we’ve covered the social presence of Nike versus its much smaller competitor Reebok. Now that we have new social analytic tools at our disposal, we can continue the comparison with some cool insights. I used both TOPSY and socialmention*.
Starting off with tweets per day
While it was clear Nike would have many more mentions on Twitter, . I took a look at the past month and found an interesting pattern. Nike is much more volatile. It goes from ~70K to almost ~200K with a day (new campaign launch), dropping back just as fast to around ~90K for the rest of the week. The news just doesn’t stick, it gives only a temporary bump. Reebok on the other hand is much more stable, sure it has some ups and downs, but they tend to take a while to build up and then decrease. Funny enough, when comparing to the generic term “sneaker” – we can see that it has consistently outperformed the Reebok brand. So is the brand weaker than the product, or is Nike the outlier by being strong than its product (like “Frigidaire” used to be compared to “Refrigerator”).

Sentiment
In this case – it’s a tie. Topsy reports that over the past month Reebok had a positive vs negative sentiment score of 70 (from 154K tweets) versus Nike’s 72 (from 2.5m tweets).
Socialmention gives us a bit more in-depth information. It rates Reebok as heaving a 39% reach and a 12:1 sentiment ratio – meaning 12 positives for each negative mention and a huge neutral majority. Nike o the other hand, has an ever so slightly larger reach of 46% with a better sentiment ratio of 16 positives for each negative.
Filed under 2014 - Post 3, Analytics
More cars- Tesla vs Maserati
Like many, I was a bit surprised when I watched a 90 second Super Bowl ad not knowing up until the last 3 seconds that it’s about the Maserati Ghibli 2014. As a Super Bowl newbie (don’t judge), I thought it was a long and expensive ad, but I only realized the significance of it later: Maserati has never run any ad before in the US and the particular model, Ghibli is newly introduced in 2014 as the ‘baby-Quattroporte’, the Italian car manufacturer’s first foray into the under 100k, luxury mid/full-size category.
Although the Tesla Model S is firmly in the full-size category, the entry price points of the two cars (~$70k) and the fact that both are out of the ordinary luxury vehicles make them competitors (if you can ever call any luxury car ordinary).
Market Context
I believe Tesla needs no introduction, but it’s interesting to know that their European expansion plans are very healthy: they launched Model S in August 2013, sold about 7,000 cars since in Europe and they are aiming for 10,000 cars per year by 2015, just in Germany. Sales volume is still by far the highest in the US, but the Tesla top sales list has 10 European countries, with Norway leading from second spot.
Maserati on the other hand has 30-40% of its sales coming from the US, the rest is dispersed in various other regions, Asia and Middle East included. Said to be the rough diamond of Fiat Chrysler with great profit upside potential, Maserati now wants to capitalize on the economic upturn and the cachet of the brand by targeting a sales volume of 10,000 Ghiblis in the US for 2014. Their cheapest model thus far was the Quattroporte for a mere $102k.
Social media presence
Based on analysis from socialmention, Tesla is definitely leading in brand strength, but Maserati’s much higher passion score could mean that there’s a strong, tight advocacy group of influencers who like the brand.


Looking at the peaks and troughs from the Topsy analytics however, we see a less balanced view and the Tesla Model S social media buzz is more lively than the Maserati, not just at the notable point on 04/13/14, when a cartoon on Tesla ownership was published.

We do however have to take into account other differences:
– Aside from the obvious electric car aspect, the Tesla Model S has been around for a while to build a loyal following, but the Ghibli 2014 is the new kid on the block, with much lower brand recognition in the US.
– Elon Musk’s Klout score is 86. Anyone heard of Harald Wester or Peter Grady? Thought so.

– Looking at the socialmention measures several times over the course of 24 hours, fluctuations in social media activity show regional differences: daytime in Europe tends to improve on the Maserati metrics, but US West Coast time zone sees a lot of Tesla chatter. The emphasis in target markets for both brands is just the opposite, as per above, so the marketing campaigns make sense: Super Bowl ad for Maserati and free performance configuration for the Autobahn for German Tesla customers. (Keeping in mind that Model S is closer to $100k in Europe.)
– Like with all social media presence, exact measurements for intent to buy and conversion are hard to establish, and it was long debated that luxury products don’t mesh well with the openness of social media, companies thinking that it would dilute the exclusivity of their product. That said, Maserati Ghibli had to create brand awareness very fast to compete with other vehicles in its category and to try punch above its weight. If we accept that the intent of their campaign is to send customers window-shopping and convert them in-store (like many other luxury retailers), then the response to the Super Bowl ad hints at success: new car searches on the Kelley Blue Book site for the Ghibli has increased by 4,250% after the ad aired. However, follow-up on social media channels was probably not as strong as it could have been.
By the way, the cartoon is pretty funny too: http://theoatmeal.com/comics/tesla_model_s
And of course: #NoTESTAndy
Filed under Uncategorized
Seattle Sounders and Seattle Reign
Sounders FC is a professional men’s soccer club located at Seattle WA, competing in Major League Soccer. Seattle Reign FC is a professional women’s soccer team based in Seattle, Washington, playing in (NWSL) National Women’s Soccer League.
Sounds FC’s home field is CenturyLink, while Reign’s home field is Memorial Stadium (Seattle). These two fields are close: it takes about 15 minutes to drive from one to the other. Also, these two club’s home game schedules do not conflict with other. Both these clubs use Twitter as a social media to promote themselves.
Following is an analysis of their usage of Twitter:
1. Twitter
Data below shows that Sounders started to use Twitter much earlier than Reign. This is not surprising because Reign FC was founded in 2012 and started to play in 2013.
Account @SoundersFC @SeattleReignFC
Tweets 21.1K 2,474
Photos/Videos 1,090 275
Following 301 225
Followers 107K 15.5K
Joined 11/2008 N/A
2. TOPSY data
Both Reign FC and Sounders FC have good (80+) sentiment scores: they have been performing relatively well this season. In particular, Reign has won all 7 games so far. Tweet reply trend is that on a game day, the number of replies climbs. In the past 30 days, Reign has about 13K replies while Sounders has about 15K replies. Both clubs have done a good job. Also, it is interesting that there were not as many replies as expected to sounders when Sounders lost to NE by 0:5 on 5/11.

Specifically, 30-day trend is as follows:

Sounders FC

Specifically, 30-day trend is as follows:

Summary Based on the analyses above, we know that both clubs have a solid base of fans (using Twitters) and that both clubs have high reputations. We can say that use of Twitter enables fans to talk about their clubs and players more conveniently during games. Also, it’s implied that Seattle is a soccer city, and people like talking about soccer games, whether they are played by men or women.
Filed under Uncategorized
Honda vs Toyota – Social Analytics
I continued my comparison on Honda and Toyota from my assignment 1 where I had tried to research their social presence and had observed that Honda was active as compared to Toyota. (9.5k vs 6.5k tweets. Hence, I have researched more using following tools on how active these companies and their followers are:
1) Followerwonk

Clearly, the user base for Toyota (19k users) is substantially large as compared to Honda (1.2k users) even though Honda offers more products than Toyota in the market and have a high tweeting and engagement rate compared to Toyota. Followerwonk shows only 0.5% of tweets being retweeted for Honda as compared to 16.5% for Toyota, @contacts for Honda though are much higher compared to Toyota. The URL tweets for Honda (13%) are also low compared to Toyota (27%).
2)Topsy

The analysis from Social Mention can be verified here with Topsy to show Honda has been highly active in tweets for past month compared to Toyota. Its tweets seem to average around 23k per day as opposed to Toyota (@13k). The numbers are not similar in the reports but the activity is proportional in both the tools.
Filed under Uncategorized
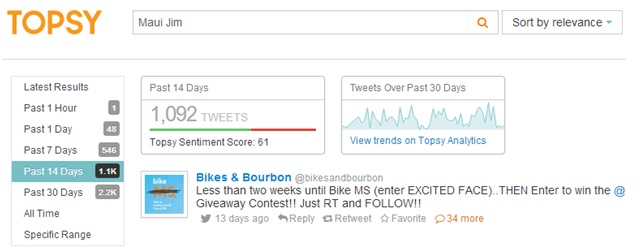
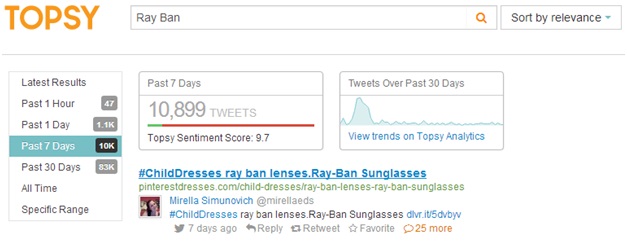
Maui Jim vs. Ray Ban – a comparative analytics !!!
Comparing the Topsy results for Maui Jim and Ray Ban tweeter performance, it was noticed Ray Ban (@ray_ban) has way more tweeter handle reference than Maui Jim (@OfficialMauiJim). While Maui Jim has only 2.2K tweeter handle reference, Ray Ban has a whopping 83K references. That implies Ray Ban maintains a much stronger marketing and social media presence over Tweeter. Although, it’s interesting to notice Maui Jim’s sentiment score (61) is quite higher than Ray Ban (9.7), and this may be due lower number of tweets and social presence drew lesser resentment for Maui Jim.
Maui Jim – Topsy results:
Ray-Ban – Topsy results:
Both Maui Jim and Ray-Ban shows very similar influence score in Klout. This might be because of their almost equivalent number of channel presence (facebook, twitter, pinterest, youtube etc). It’s fascinating to see a much younger Maui Jim achieved an influence score very close to its pioneer rival Ray Ban. Detailed analysis on this influence score is not available as Klout uses its proprietary algorithm to deduce this number.
Maui Jim – Klout results:

Ray-Ban – Klout results:

Filed under Uncategorized
Bank Of America Vs. Wells Fargo bank -Winning the retail customers
Bank Of America Vs. Wells Fargo bank
Winning the retail customers
BOA:
Bank of American and Wells Fargo banks are leading consumer banks in United States. Bank of America has been recovering its image from mortgage mess create due to foreclosures.

Wells Fargo:
Wells Fargo bank has been steadily growing in personal, small business and commercial markets.

I used Topsy, socialmention and followerwonk, as social media analytics tool.
Customer service accounts: @Ask_WellsFargo, @BofA_Help. I am trying to find how actively these 2 banks use twitter for customer service and how much the users and banks are involved.

Analyzing the activities, BOA is certainly ahead of the Wells Fargo. The data shows that BOA users are actively using twitter for customer support and BOA is actively addressing it. Wells Fargo has relatively lower number of tweets.
Data from socialmention
BOA:


Wells Fargo


Comparing the sentiments of BOA and Wells Fargo, it is 3:1 for BOA, where it is 2:1 for Wells Fargo, whereas based on Passion, Wells Fargo in ahead of BOA 35% vs. 26%.
Looking at the top hash tags – BOA has iwillexposeyou, which denotes the users’ resentment. People might be still upset with BOA, due to the mortgage crisis. Similarly Wells Fargo top hash tags are not related to wells fargo, but occupy Wall street. All these hash tags denotes people’s opposition to the big Wall Street companies. May be these topics are highlighted because the users opposing these big banks are more active.
From followerwonk: Comparison of followers of BofA_Help & Ask_WellsFargo
The data shows that BOA has greater number of followers than Wells Fargo. Both of them have high user engagement, but BOA is ahead in Average followers per day and total tweets.

Conclusion:
BOA has been utilizing social media for customer service and awareness. This might be due to their efforts towards regaining customer confidence and rebuilding their image. We see some resentment from users against these big Wall Street companies. It seems like BOA is working in the right direction and utilizing the social media to connect with the consumers and provide them help as needed. Wells Fargo has been doing well, but need to increase the customer engagement.
Filed under Analytics, Class Notes
Social Analytics – T-Mobile vs AT&T
Using Social Mention, looks like T-Mobile and AT&T both have some pluses and minuses. T-Mobile has a bit stronger sentiment than AT&T, however AT&T is considered stronger and has more reach. This is somewhat understandable considering they have over double the amount of customers.


Topsy shows somewhat the same thing… that the companies, while each very unique, are even-strength when it comes to social.

Filed under Uncategorized
Redfin and Zillow – not so different after all
I was on the market for a house a couple of months and used the Redfin app to look for homes. I do wonder if using Zillow would have been any different. I searched in Topsy and Social mention for both companies to see if I could find any reason why a regular ‘Joe’ like myself would want to use either.
Selena Gomez put her house on the market in early May! That was the reason why there were so many tweets on May 1st. Aside from a celebrity’s house being listed on Redfin, it is not very clear what can be deciphered from the sentiment numbers. From the Zillow side, it seems that their announcement to predict future home values got a lot of attention on May 8th, along with some ‘positive’ labeled sentiments. Sentiment scores from both Topsy or Zillow were relatively constant even during these type of announcements.
Both companies have many neutral sentiments; my reasoning is because costumers are not paying for the services, so it is not common for someone to complain. Zillow is a more widely known company and their social media data reflects that. Both Redfin and Zillow seem to be responsive to tweets addressed to them, and no groundbreaking occurrences have come from these two companies lately. It is safe to say social media content on Redfin and Zillow does not help determine which one has a better application or features, but we can say that they are both responsive to their followers and Zillow has a greater audience tuned in.
 href=”https://entre528.files.wordpress.com/2014/05/images_page_1.jpg”>
May 19, 2014 · 2:55 pm
More bad news for Snapchat!
Uh-oh, it is Snapchat making the news again! To dilute our discussion of social media analytics a tiny bit, here is an interesting development that was recently highlighted in a legal blog I follow. It turns out that Snapchat’s images were not as ephemeral as promised!
And what do you know? As I was typing this post with CNBC talking heads droning in the background, I heard them saying that Facebook just announced that it was working on a Snapchat-like image sharing feature – Slingshot. Surely enough, it is today’s big Facebook news:
Oops. Is this going to be the end of Snapchat? Or does it signal a beginning of lengthy legal battle?
Filed under Uncategorized
The Battle between Honda and Toyota
Honda and toyota have long fought over the attention of the American public. Now that battle has taken to a new stage as Social media becomes an important factor for both companies and society as a whole. To better understand this trend, I used Social Mention, Topsy, and Wonkfollower as my analytics tools of choice.
Honda


Toyota


The actual number of posts with positive sentiment was fairly similar between the two car makers (85 to 89). However, Toyota shows more strength and passion due to the larger number of neutral posts made by Honda. The amount of negative sentiment was small for both companies.
Topsy

Honda shows a larger more consistent social media presence than Toyota.
Followerwonk

Consistent with the Topsy analysis above, Honda shows a stronger follower base. Toyota has followed much more than Honda but it hasn’t been recipricated.
From this Analysis, Honda appears to have a larger social media presence but it isn’t being as favorably received in terms of sentimment percentages. Dispite the differences in social media between these companies. The trend of not having a test is very clear. #NoTESTAndy
May 19, 2014 · 6:30 am
Hulu vs Netflix: Content Show Down
Hulu vs Netflix: Content Show Down
My analysis was based on HULU & NETFLIX, two great video services I use for entertainment. While they both provide content for a monthly fee, they each focus on different content types primarily. Hulu, on current tv shows. And Netflix on back catalog tv shows, blockbuster movies, and documentaries. They offerings attract different audience types which engage differently across social media.
Volume Winner – Netflix
Netflix has been in business a lot longer than hulu, and has built a wider audience and global presence. As a result, Netflix has 10-15x volume of tweets each day compared to Hulu. [Source Topsy]. Netflix also has more citations in blogs, by about 2:1, than Hulu. [Source: Icerocket]. The volume hear is likely driven by audience size, given both companies are very active on social channels.


![]()

![]()
Engagement Winner – Hulu
While Netflix has much greater volume of tweets / day than Hulu, they don’t have nearly the positive sentiment ratio as does Hulu. Looking at the positives / negative sentiment ratios, Netflix has a small 4:1 ratio vs 29:1 ratio for Hulu. Hulu has both more people saying positive things as well as less people saying negative things, relatively speaking.


Sources – Photobucket, Friendfeed, and everything else
I hadn’t realized photobucket was such a huge source for social mentions, in general, and then especially for hulu and Netflix. It was the single biggest source. For some limited research, it seems there were pictures of actors and tv or movie scenes. But even for other test searches for other companies, Honda and Red Robin, showed photobucket as a top source of mentions. Didn’t see that coming. Notable absentee is twitter for both Netflix and Hulu. (Red Robin had twitter as its second highest source).


Aaron Lauper
Filed under Uncategorized
The Battle of the Clouds

Cloud computing is today’s fastest growing segment of technology. Cloud companies are categorized into three main segments: IAAS (Infrastructure as a service), PAAS (Platform as a Service) and SAAS (Software as a Service). In the first two segments, IAAS and PAAS, Amazon Web Services (AWS) is the undisputed leader, with 30% of market share and $1 billion of revenue per quarter. Competitors such as Microsoft Windows Azure, Google Cloud Platform or VMWare among others, are trying to unseat Amazon’s as the world’s leader in cloud. Does Amazon Web Services has the same dominance on social media? To analyze how Amazon compares against its rivals on social media, we’ll use the following tools: Twitaholic, Followerwonk, Topsy, Keyhole, and SocialMention. The analysis will focus on Amazon Web Services (@awscloud) and Windows Azure (@azure).
Let’s start with Twitaholic which provides basic information about Twitter users.
Twitaholic
Twitaholic is a directory of Twitter users.
@awscloud achieves better ranking than @azure by followers and in their respective geographical area within the Seattle metropolitan area.

Followerwonk
Followerwonk provides detailed reports on Twitter users, as well as comparison between multiple Twitter user.

Followerwonk shows us that @azure is currently more active than @awscloud, achieving a greater engagement rate, total number tweets, number of followers and a more important social authority. It is worth noting that @awscloud has more retweet than @azure.
Topsy
Topsy provides social media analytics allowing to search by time and place, set alerts, and analyze sentiment for tweets.
Topsy confirms that @azure is more active on Twitter than @awscloud.


Keyhole
Keyhole provides real time tracking of tweets, hashtags, URl, Instagram and Facebook account.
Keyhole gives us a better insight on both @azure and @awscloud. As shown in the picture below, we can see that @azure has more original post that @awscloud, but the later has more retweet than the former. They both are located in the same regions, with an important presence in North America, western Europe, and Australia. Emerging countries such as India and Brazil are also very active. It’s very interesting to note that China and Russia are not represented. Tweets for both accounts are cloud related, with more sources for @azure. Finally, the demographic of twitters for both products is male centric.

Social Mention
Social Mention is a social media search engine that searches user-generated content such as blogs, news, videos.
Once again, Social Mention confirms the important engagement of @azure, confirmed by its strength and passion. The overall sentiment for both companies is neutral, with slightly more negative for Microsoft (7 vs. 3).

“The Battle of the Clouds” on social media is won by @azure, but @awscloud has become more engaged. It is hard to tell if the edge Microsoft has on social media is due to the fact that Azure is playing catch to Amazon Web Service.
May 18, 2014 · 11:04 pm
Costco vs Walmart – social media metrics and analysis

Much ink has been spilled on how Costco and Walmart compete in retail but how do the two giants compare in social media? Let’s find out.

The most visible and surprising result is that costco has 4 tweets, EVER posted from their main account, @costcotweets, compared to the two hundred thousand sent by @Walmart. Costco uses their facebook page as their primary presence in social media. As a result, their social mention scores are nearly equal to walmarts, tied in passion and sentiment, and one each leading. Twitter analyzing Moz.com tool, Followerwonk reflects this in the social authority scores, with Walmart winning. Despite completely Costco’s efforts in ignoring the fact that twitter exists and that they have a corporate twitter account, they are successful in their business and people love the brand. Customers will refer to Costco on social media as seen in the chart below, though at a level that is 1/5 of Walmart’s mentions.


Due to the strength of Costco’s facebook presence, their Klout score is a respectable 58. However, Walmart turns in a monstrous 90 for their Klout score as they are very active in twitter and facebook. Walmart has 9 twitter accounts for specials and different regions.
Despite the difference in effort put into their respective social media presences, Walmart and Costco customers use the medium to talk to or talk at the companies. There is untapped potential to address customer service concerns that are going unanswered at Costco. Walmart is communicating deals out to their followers while both are clearly communicating via traditional advertising.
Filed under Uncategorized
UW VS WSU THROUGH THE LENS OF SOCIAL MEDIA
Washington State is the home of two great public institutions of higher education: University of Washington and Washington State University. Naturally, a friendly (?) rivalry exists between these two great schools. Fans of the universities can argue for hours about which one is better than the other, using football, NIH funded research, number of grads among Fortune 500 execs, ranks of their MBA programs, and other similar metrics. Trying to be free from any bias towards my alma mater, I am going to compare the two schools using the social media tools. First, let’s look at Social Mention. Although both schools can be mentioned under multiple names, I used “University of Washington” and “Washington State University” as the key words for simplicity, and here is the result:

UW definitely has higher social media reach and more mentionings than WSU, but WSU wins when it comes to the sentiment. Could it be possible that the negative sentiment is coming from the rivals, such as fans of the opposite football team, and high negative sentiment actually reflects negatively on the other school? To figure this out, more research, such as detailed review of the negative mentions, needs to be done.
Let’s now shift gears a bit and take a look at what Moz has to say, using the Followerwonk tool, and here is the result:

Both schools have similar social authority, but UW clearly has an edge when it comes to the number of followers. However, it has fewer retweets, with only 21.5% of all tweets being retweeted by the followers vs 26.5% for WSU, which tells me that the followers are somewhat less engaged. Certainly enough, the following bar graph shows that the user engagement for UW (yellow) is lower than that for WSU (green). UW has fewer tweets per week and overall number of tweets, but certainly outranks WSU 4:1 in the average daily number of followers, which led me to explore Topsy. And here are the interesting findings, shown in the two graphs that follow. WSU’s Twitter activity has been somewhat sporadic in the past month compared to the steady number of tweets for UW:


This is somewhat surprising, given the Followerwonk’s numbers for the two schools’ tweets. To decipher where the differences come from (e.g., a significant drop in activity by WSU in the past month due to some event), one needs to dig deeper into that issue.
Bottom line: the web and social media presence analytical tools give an interesting, fresh look at the two universities from a new perspective, and a short exercise in applying these tools generates a lot of questions that call for more detailed research.
Almost forgot, but here it is:

Happy Monday!
Filed under Uncategorized
May 18, 2014 · 10:39 pm
